
Friday, June 12, 2015
Thursday, June 11, 2015
Amsterdam Will Put New Housing on 10 Artificial Islands - CityLab
Amsterdam's Bold Housing Solution: 10 Artificial Islands
To create the islands, the Dutch use a technique called the “pancake method.”

Right now, Amsterdam’s Center Island (Centrumeiland in Dutch) doesn’t look like much—just an inhospitable sand bar poking out from the city into the huge IJmeer Lake. But there’s far more to it than meets the eye at present. The island, in use for the first time this summer as a campsite-cum-art installation, is in fact an entirely artificial creation, lying at the heart of what could currently be Europe’s boldest engineering and housing program. This sand bar will become one of 10 new residential islands rising from the depths of the IJmeer. In a distinctively Dutch move, Amsterdam is not only planning for future expansion by building a network of model neighborhoods to expand into—it has actually constructed the ground on which those neighborhoods will stand.
Construction of this new archipelago, called the IJburg, began in 1997, and so far six of the total 10 planned islands are complete. To construct the islands, the Dutch used a technique they call the “pancake method.” When an island is built-up this way, porous screens are placed in the water to hold the island’s shape and sand is sprayed into the screens to form a layer of batter-like sludge. As this layer settles and drains through the fine mesh, it hardens and another layer of sand is sprayed on top. Pancake by pancake, the island rises until it is two meters above the water level.

The first six islands built this way are now inhabited, albeit not entirely built-up and populated to their maximum capacity. Residents first moved onto the islands in 2002, and the city’s tram network was extended to them in 2005, bringing what was once a backwater within 15 minute of Amsterdam’s Central Station. The islands have been covered with an attractive mix of low- and medium-rise housing, threaded with self-build plots and some floating homes. While the three main islands contain many mid-rise buildings laid out on urban streets (as you can see here on Street View), the three smaller islets between the main islands and the coasts have a more explicitly suburban character. On the islets, low-rise single-family homes are grouped along the shorelines, which will ultimately be filled in with gardens and reed banks. Each of the six islands is purposely thin in order to maximize water views.
The construction of the archipelago marked a significant departure for Amsterdam. From the 1960s to the 1990s, finding space for the city’s overflow population primarily meant constructing new towns far from the city core. New settlements such as Almere and Lelystad (both also built on reclaimed land) fed the sprawl that has effectively turned all the major cities of the Netherlands into a single conurbation. By constructing the IJburg, Amsterdam took a new direction. The land is still reclaimed, but it is far closer to the city’s historic center. Instead of treating Amsterdam as complete and starting again elsewhere, the IJburg plan has managed to find more space in a city that thought it had no more left.
The gradual construction of the final four islands—a project called IJburg II—is finally due to begin after a few years of zoning wrangles that stalled full development on Center Island, leaving it as a bare promontory. What the city of Amsterdam calls a “start vision” (essentially a loose blueprint) was agreed to on March 24 of this year.
The last pancake of sand needs to fully settle before Center Island is ready for building, but construction of between 1,000 and 1,200 new homes should begin in 2017. Three other islets called Outer, Middle, and Beach Islands (Buiteneiland, Middeneiland, and Strandeiland in Dutch) are also planned. Should Center Island prove successful, they will emerge soon after in the open waters beyond. If you look on Google Maps, you’ll see their names already there, hovering eerily over the water. When fully complete, the archipelago will be home to a population of up to 45,000 people in 18,000 homes, 30 percentof which will be earmarked for affordable rent.
That pause between phases of constructing the IJburg islands was arguably beneficial because it allowed some key concerns about the program to be heard. Most of these focused on the IJmeer Lake itself. A vital habitat for birds, it’s a wide-open space that a crowded, densely built-up country like the Netherlands can ill afford to spoil. The lake is a place of austere but unmistakable beauty—arriving suddenly at its banks and seeing its great sweep out in front of you is one of the scenic highlights of the Netherlands. If handled poorly, building further along its banks could scare off the birds, disrupt the waters, and ruin the views. The pancake method itself can also be a problem, as it was with the earlier islands. According to Cobouw, a publication about construction, during bad weather, the screens holding the islands’ shape sometimes ripped and leached sludge onto the lake bottom, requiring repair and threatening mussel beds.
Center Island’s construction should avoid these pitfalls. To give extra protection to the island’s sludge screens by sheltering them from the current, a 600-meter breakwater has been constructed to the east of the island site. And following the input of the public from a year-long consultation at theAmsterdam Architecture Center, the future islands will probably be leafier and more low-rise than initially envisaged, each with a band of green around their fringe to preserve lake views. The new islands will also be energy self-sufficient. Developers are entertaining the idea of rooftop solar cells and district heating to achieve this goal, in addition to giving more space to self-builders. Based on experience from the IJburg’s earlier islands, self-builders are more likely to install well-insulated, eco-friendly heating and wastewater systems.
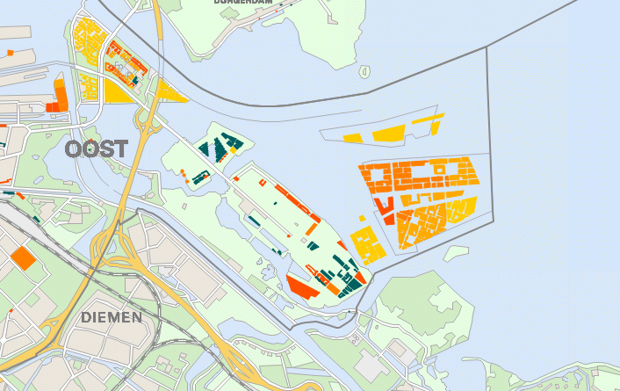
None of this is likely to happen that fast. The Amsterdam housing plan projections shown in this map reveal that parts of the new islands will likely not be constructed until after 2026. That needn’t be a drawback. The refinement of the whole IJburg project over time shows the benefits of gradual development in engaging the public and improving the end product. After all, if you’re going to create a city neighborhood out of what was once just a stretch of open water, it pays to take your time.
Thursday, May 28, 2015

Monday, May 11, 2015
DivGro: 10 Dividend Growth Stocks for May, 2015
DivGro: 10 Dividend Growth Stocks for May, 2015: David Fish's CCC list is a great resource for dividend growth investors. The list is updated every month and contains all U.S.-listed s...
Friday, May 8, 2015
Drones for Defense
Excerpts from Seeking Alpha
Satellite communications as a set of technologies and as a critical national defense and security
resource and as a commercial industry is in the midst of a disruptive phase that is inspiring a new wave of innovation
that Kratos is uniquely well positioned to capitalize on.
There are several factors driving this disruption, with the primary one being a seemingly insatiable demand for
bandwidth being driven by the rise of UAVs and drones, unmanned systems and the need to communicate and control
with them, including without interfering with other forms of communications, the increasing reliance on GPS for
location targeting and communications, the increasing demand for streaming video, including high definition, data and
ISR, the growing Internet of Things where even the most mundane objects from cars to watches and other devices are
constantly connected to the Net, and the opening of underserved markets in areas such as Africa and South America,
along with increasing demand in established and emerging markets for services such as cellular, backhaul and HDTV.
This growing demand is driving research, development and implementation of new technologies in the satellites
themselves, including for example, high throughput satellites, or HTS, which deliver many beams to multiple locations,
all electric satellites, modular payloads and small sats, which cost a fraction to manufacture and launch than traditional
satellites. Small satellites may be particularly disruptive because this is bringing in an entirely new set of large and
well financed entrepreneurial players to space, such as Google, SpaceX, Yahoo! and similar Silicon Valley type
ventures.
National security requirements are also driving this disruption. For example, I previously mentioned unmanned
systems, where as you know Kratos is currently a major player and we're making a very large investment. There is also
growing demands on bandwidth for other defense and intelligence uses and the threats to these satellite resources
themselves are growing dramatically. Related to this, if you saw the segment on 60 Minutes two weeks ago, you know
that the Department of Defense has become increasingly frank and open about physical, cyber, jamming, electronic
and other forms of warfare that are targeting our ability to communicate over satellites and in space. This has led
senior U.S. Defense leaders to comment repeatedly that one of their greatest interests is to fundamentally increase the
resiliency and the protection of satellite capacity, with spending northwards of an incremental $5 billion being
mentioned.
We believe Kratos is extremely well positioned to capitalize on these disruptions and challenges and opportunities, with
the most important being Kratos' unique place as the leading endtoend enterprise ground systems products and
solutions provider, with Kratos solutions touching virtually every element across the ground segment. We believe that
Kratos is the only solutions provider that has such a broad set of integrated strategic products with enterprise grade
reliability including at the United States Air Force, where Kratos products are used in virtually all key programs.
These are just some of the reasons why we are very excited and optimistic about the opportunities we have in the
SATCOM, signal monitoring and related cyber area. Along with our earnings release today, we included a description
of three of Kratos' newest satellite communications products, which address these new opportunities and we are
looking for this business to be one of Kratos' fastest growing and most valuable going forward.
5/8/2015 Kratos Defense & Security Solutions (KTOS) Eric M. DeMarco on Q1 2015 Results Earnings Call Transcript | Seeking Alpha
http://seekingalpha.com/article/3157966kratosdefenseandsecuritysolutionsktosericmdemarcoonq12015resultsearningscalltranscript?page=1 4/13
On the strategic alternatives review that the Kratos board of directors is undergoing and consistent with what we stated
in our March call, we fully expect to be able to communicate the results of the review, no later than the end of Q2 and
we are unable to provide any further comment at this time. And Kratos' executives remain in a window where we
cannot purchase or trade in Kratos stock.
With that, I'll turn it over to Deanna.
Deanna Hom Lund Chief Financial Officer & Executive Vice President
Thank you, Eric.
Good afternoon. Our first quarter revenues of $182.5 million came in our expected range of $180 million to $190
million. First quarter revenues were impacted by delays in certain contract awards, shipments of unmanned aerial
drone system targets and delays in shipments of hardened mobile tactical facilities in our Modular Systems businesses.
A number of our production contracts generate revenues as the units are shipped and delivered as opposed to on a
percentage of completion basis. Accordingly, there can be up to a six month or so delay in revenue and EBITDA
generation, after contract award until product delivery occurs. Cash flow is also impacted in these instances, as the
contractual terms under these types of projects typically do not provide for payment until shipments occur.
On a year-over-year basis, revenues increased for our KGS segment from $131.5 million to $132.5 million, inflecting
growth in our Simulation and Training business of $2.6 million, and in our Technical Government Services business of
$4.8 million, in which we support directed energy weapons and electromagnetic railgun efforts, partially offset by a
reduction in our legacy government services revenue of $5 million and reduced shipments of electronic products and
specialized ground equipment.
On a year-over-year basis, as we forecasted, revenues declined for Unmanned Systems segment from $19.7 million to
$12.4 million, as a result of the delay between AFSAT Program Lot 10 production, which we completed in Q4 last year
and AFSAT Production Lot 11 for which shipments begin later this year in Q3, as well as delays in expected
international awards that did not occur until the second quarter of 2015, as Eric mentioned earlier.
On a year-over-year basis, revenues declined for our PSS segment from $48.9 million to $37.6 million, primarily
reflecting the completion or near completion of a number of larger security system deployment programs, which
occurred in the fourth quarter of 2014 and early 2015, as well as the company's shift in strategic focus in this business
to focus on higher margin, typically smaller security programs and only selectively bid on larger lower margin programs
going forward.
As we have mentioned on our last conference call, we made significant personnel and cost reductions in the first
quarter, which we should start realizing the full impact of in the second quarter, specifically in our PSS business, as we
have reduced our cost structure in line with our recent change in strategic focus on lower volume, higher margin work.
Our adjusted EBITDA of $11.6 million for the first quarter is from continuing operations and excludes the following
charges, which have been reflected as adjustments since we either believe the items are nonoperational and/or nonrecurring
in nature. Acquisition and restructuring related items at $1.9 million, which includes employee termination
costs of $900,000 as we continue to rightsize the business and excess capacity cost of $600,000 in our Unmanned
Systems business, $300,000 of increased costs related to pending customer change orders related to scope increases
and additional work performed in our PSS business, $400,000 of transaction, foreign transaction losses and $100,000
related to potential strategic transaction related expenses.
We have now recently submitted change orders for two sizable PSS projects, both of which have been recently
completed. We believe we will be successful in obtaining customer change orders to reimburse us for a good portion of
the additional work we have performed based upon our historical experience. However, for accounting purposes, we
have recorded all the costs we have incurred on these two projects without reflecting any of the anticipated change
orders we have submitted or are in the process of submitting, until actual receipt of the signed change orders or receipt
of the change orders is imminent.
As expected, our adjusted EBITDA was impacted by the continued increased IR&D investments during the first
quarter, which were at $4.8 million or 2.6% of revenues including in the unmanned systems, satellite communications
and electronic product areas. On a GAAP basis, net loss for the first quarter was $16.3 million, which included $4.6
million of expense related to amortization of intangible assets, noncash stock compensation expense of $2 million, as
well as a $2.4 million income tax provision.
5/8/2015 Kratos Defense & Security Solutions (KTOS) Eric M. DeMarco on Q1 2015 Results Earnings Call Transcript | Seeking Alpha
http://seekingalpha.com/article/3157966kratosdefenseandsecuritysolutionsktosericmdemarcoonq12015resultsearningscalltranscript?page=1 5/13
Moving to the balance sheet and liquidity, our cash balance was $34.4 million at March 29, plus $1.6 million of
restricted cash. Cash flow from operations for the first quarter was a use of $2.9 million, resulting primarily from an
increase in DSOs from 102 days at the end of the fourth quarter to 119 days at the end of first quarter. As expected,
the net working capital requirements in the first quarter, primarily related to the build of inventory and product as we
are producing units that are not expected to be shipped and ultimately billed until the second half of the year once
shipments have occurred and contractual billing milestones have been achieved and completed.
As we have discussed previously, our DSOs can fluctuate due to milestones and shipments on our production type
contracts, which will likely continue to impact our DSOs and cash flows from operations in the future. As we discussed
earlier, as the revenue is not recorded and billing milestones on a number of our contracts is not achieved until units
are shipped and delivered, our revenues, EBITDA and operating cash flow will be impacted in the near term.
Our contract mix for the first quarter was 81% of revenues generated from fixed price contracts, 14% from cost plus
type contracts and 5% from time and material contracts. Revenues generated from contracts with the Federal
Government were approximately 61%, including revenues generated from contracts with the DoD and with nonDoD
Federal Government agencies. We also generated 5% of our revenues from state and local governments, 20% from
commercial customers and 14% from foreign customers with our aggregate nonDoD revenues comprising 39% of our
total revenues. Backlog at quarter end was $1.1 billion with $650 million funded and $409 million funded – unfunded.
Backlog at the end of Q4 was $1.1 billion.
Now on to the financial guidance that we are providing at this time. As Eric mentioned previously, we are affirming our
previously communicated second quarter and fiscal 2015 guidance. We currently expect a slight second quarter
sequential revenue increase as we focus on higher margin PSS opportunities and as our business mix in our
Government business improves, including higher margin satellite communications and signal intelligence work, and we
expect second quarter adjusted EBITDA of approximately $14 million to $17 million.
As we communicated on our last quarter call, we recently reached agreement with our UCAS government sponsor,
which includes a onetime $3.5 million Kratos investment, along with certain government provided systems equipment,
access use of government facilities and government personnel and services. The agreement was structured so that
Kratos will retain 100% ownership of the intellectual property, technology and data rights to this unmanned combat
aircraft. Accordingly, we will separately identify and exclude from our continuing results this $3.5 million nonrecurring
IP related investment, which will commence in the second quarter and is expected to be completed by the fourth
quarter. And we will keep you informed of our UCAS initiative progress.
The excess capacity at our Unmanned Systems segment is expected to continue throughout the balance of 2015 due
to the expected timing of production based on anticipated awards compared to total manufacturing capacity. We plan
to continue to exclude the unabsorbed overhead costs through the balance of the year consistent with last year. We
expect revenue and EBITDA to continue to increase in Q3 driven by increased product deliveries and execution on our
under contract programs. And we expect Q4 revenue and EBITDA to approximate or be slightly higher than Q4.
We're continuing to make investments from an IR&D and CapEx perspective in certain of our Electronic Products,
Satellite Communications and Unmanned Systems businesses. Our total estimated CapEx for 2015 is $15 million to
$19 million, with the most significant investment being in our Unmanned business, as we will be manufacturing an
increased number of aircraft for expected customer presentation requirements and includes production of UCAS
aircraft.
Friday, April 24, 2015
Tuesday, March 24, 2015
2015’s Best States to Be Rich or Poor from a Tax Perspective | WalletHub®
Tax Burden By State and Income Level

State | “Low Income” Rank (Tax Burden as a % of Income) | “Middle Income” Rank (Tax Burden as a % of Income) | “High Income” Rank (Tax Burden as a % of Income) |
|---|---|---|---|
| Alabama | 25 (9.61%) | 20 (8.82%) | 9 (6.03%) |
| Alaska | 1 (5.40%) | 1 (4.50%) | 1 (3.43%) |
| Arizona | 48 (11.70%) | 18 (8.75%) | 18 (7.36%) |
| Arkansas | 46 (11.46%) | 49 (11.29%) | 37 (9.16%) |
| California | 21 (9.49%) | 15 (8.58%) | 39 (9.35%) |
| Colorado | 14 (8.68%) | 17 (8.73%) | 16 (7.26%) |
| Connecticut | 34 (10.04%) | 46 (10.77%) | 50 (11.19%) |
| Delaware | 2 (5.43%) | 2 (5.70%) | 10 (6.14%) |
| District of Columbia | 7 (7.76%) | 37 (10.16%) | 43 (9.80%) |
| Florida | 17 (9.23%) | 10 (7.67%) | 7 (5.56%) |
| Georgia | 30 (9.87%) | 30 (9.77%) | 30 (8.46%) |
| Hawaii | 50 (12.30%) | 48 (10.86%) | 31 (8.72%) |
| Idaho | 11 (8.47%) | 11 (7.73%) | 22 (7.94%) |
| Illinois | 49 (12.10%) | 50 (11.30%) | 44 (9.83%) |
| Indiana | 44 (11.19%) | 45 (10.72%) | 24 (8.19%) |
| Iowa | 39 (10.47%) | 35 (10.03%) | 33 (8.90%) |
| Kansas | 29 (9.84%) | 26 (9.50%) | 26 (8.31%) |
| Kentucky | 41 (10.62%) | 40 (10.44%) | 35 (9.10%) |
| Louisiana | 35 (10.05%) | 27 (9.57%) | 14 (6.91%) |
| Maine | 20 (9.35%) | 28 (9.60%) | 41 (9.59%) |
| Maryland | 26 (9.70%) | 47 (10.80%) | 49 (10.40%) |
| Massachusetts | 32 (9.92%) | 31 (9.85%) | 38 (9.16%) |
| Michigan | 22 (9.50%) | 25 (9.50%) | 25 (8.19%) |
| Minnesota | 24 (9.58%) | 33 (9.94%) | 47 (9.92%) |
| Mississippi | 42 (10.77%) | 38 (10.19%) | 15 (7.12%) |
| Missouri | 23 (9.51%) | 22 (9.20%) | 27 (8.32%) |
| Montana | 3 (6.10%) | 4 (6.59%) | 12 (6.42%) |
| Nebraska | 36 (10.23%) | 39 (10.41%) | 36 (9.14%) |
| Nevada | 4 (7.00%) | 3 (6.28%) | 3 (4.71%) |
| New Hampshire | 8 (7.99%) | 8 (7.43%) | 6 (5.36%) |
| New Jersey | 33 (10.03%) | 29 (9.71%) | 48 (10.29%) |
| New Mexico | 38 (10.37%) | 34 (10.03%) | 21 (7.87%) |
| New York | 43 (10.89%) | 51 (12.41%) | 51 (12.40%) |
| North Carolina | 18 (9.32%) | 24 (9.37%) | 29 (8.40%) |
| North Dakota | 10 (8.37%) | 12 (7.92%) | 8 (5.70%) |
| Ohio | 47 (11.46%) | 41 (10.51%) | 42 (9.62%) |
| Oklahoma | 31 (9.90%) | 23 (9.34%) | 20 (7.77%) |
| Oregon | 9 (7.99%) | 14 (8.51%) | 32 (8.78%) |
| Pennsylvania | 45 (11.39%) | 36 (10.10%) | 34 (8.91%) |
| Rhode Island | 37 (10.28%) | 42 (10.65%) | 45 (9.85%) |
| South Carolina | 5 (7.08%) | 13 (8.01%) | 17 (7.31%) |
| South Dakota | 28 (9.80%) | 7 (7.17%) | 5 (5.17%) |
| Tennessee | 16 (9.17%) | 6 (7.02%) | 4 (4.97%) |
| Texas | 40 (10.57%) | 9 (7.55%) | 13 (6.53%) |
| Utah | 12 (8.60%) | 16 (8.70%) | 19 (7.75%) |
| Vermont | 19 (9.34%) | 32 (9.86%) | 40 (9.44%) |
| Virginia | 15 (8.81%) | 19 (8.80%) | 28 (8.36%) |
| Washington | 51 (13.03%) | 44 (10.69%) | 11 (6.38%) |
| West Virginia | 13 (8.65%) | 21 (8.93%) | 23 (8.13%) |
| Wisconsin | 27 (9.76%) | 43 (10.68%) | 46 (9.89%) |
| Wyoming | 6 (7.68%) | 5 (6.65%) | 2 (3.98%) |
Detailed Findings
| State | Income Level | Sales Tax as % of Income | Property Tax as % of Income | Income Tax as % of Income | Total Tax as % of Income |
|---|---|---|---|---|---|
| Alabama | Low | 6.26% | 1.23% | 2.13% | 9.61% |
| Middle | 5.01% | 1.13% | 2.68% | 8.82% | |
| High | 2.30% | 1.10% | 2.64% | 6.03% | |
| Alaska | Low | 2.44% | 2.80% | 0.16% | 5.40% |
| Middle | 1.65% | 2.75% | 0.10% | 4.50% | |
| High | 0.88% | 2.35% | 0.20% | 3.43% | |
| Arizona | Low | 7.22% | 3.42% | 1.06% | 11.70% |
| Middle | 4.66% | 2.53% | 1.57% | 8.75% | |
| High | 2.72% | 2.27% | 2.37% | 7.36% | |
| Arkansas | Low | 8.06% | 1.56% | 1.85% | 11.46% |
| Middle | 7.13% | 1.50% | 2.66% | 11.29% | |
| High | 3.93% | 1.35% | 3.88% | 9.16% | |
| California | Low | 6.25% | 2.81% | 0.43% | 9.49% |
| Middle | 4.47% | 2.71% | 1.40% | 8.58% | |
| High | 2.35% | 2.85% | 4.15% | 9.35% | |
| Colorado | Low | 4.89% | 2.10% | 1.69% | 8.68% |
| Middle | 4.07% | 2.12% | 2.54% | 8.73% | |
| High | 1.99% | 2.00% | 3.27% | 7.26% | |
| Connecticut | Low | 5.02% | 4.81% | 0.21% | 10.04% |
| Middle | 3.81% | 4.71% | 2.25% | 10.77% | |
| High | 2.46% | 4.33% | 4.40% | 11.19% | |
| Delaware | Low | 2.01% | 1.64% | 1.78% | 5.43% |
| Middle | 1.27% | 1.40% | 3.03% | 5.70% | |
| High | 0.72% | 1.26% | 4.16% | 6.14% | |
| District of Columbia | Low | 5.47% | 2.15% | 0.14% | 7.76% |
| Middle | 4.44% | 2.00% | 3.72% | 10.16% | |
| High | 2.45% | 2.15% | 5.19% | 9.80% | |
| Florida | Low | 7.32% | 1.91% | 0.00% | 9.23% |
| Middle | 5.45% | 2.22% | 0.00% | 7.67% | |
| High | 3.14% | 2.40% | 0.02% | 5.56% | |
| Georgia | Low | 5.32% | 2.30% | 2.25% | 9.87% |
| Middle | 4.30% | 2.30% | 3.17% | 9.77% | |
| High | 2.33% | 2.20% | 3.93% | 8.46% | |
| Hawaii | Low | 8.50% | 1.20% | 2.60% | 12.30% |
| Middle | 5.59% | 1.42% | 3.85% | 10.86% | |
| High | 3.06% | 1.26% | 4.40% | 8.72% | |
| Idaho | Low | 5.10% | 2.44% | 0.93% | 8.47% |
| Middle | 3.84% | 1.76% | 2.13% | 7.73% | |
| High | 2.06% | 1.60% | 4.29% | 7.94% | |
| Illinois | Low | 5.62% | 4.42% | 2.06% | 12.10% |
| Middle | 4.37% | 4.11% | 2.82% | 11.30% | |
| High | 2.48% | 4.36% | 3.00% | 9.83% | |
| Indiana | Low | 6.31% | 1.93% | 2.95% | 11.19% |
| Middle | 4.73% | 2.27% | 3.71% | 10.72% | |
| High | 2.49% | 2.05% | 3.66% | 8.19% | |
| Iowa | Low | 5.63% | 2.65% | 2.20% | 10.47% |
| Middle | 4.50% | 2.50% | 3.03% | 10.03% | |
| High | 2.24% | 2.57% | 4.10% | 8.90% | |
| Kansas | Low | 6.87% | 2.53% | 0.44% | 9.84% |
| Middle | 5.12% | 2.60% | 1.78% | 9.50% | |
| High | 2.99% | 2.68% | 2.64% | 8.31% | |
| Kentucky | Low | 5.14% | 1.71% | 3.77% | 10.62% |
| Middle | 3.83% | 1.74% | 4.87% | 10.44% | |
| High | 2.11% | 1.83% | 5.16% | 9.10% | |
| Louisiana | Low | 7.75% | 0.99% | 1.31% | 10.05% |
| Middle | 6.50% | 0.90% | 2.17% | 9.57% | |
| High | 3.39% | 0.92% | 2.60% | 6.91% | |
| Maine | Low | 5.20% | 3.01% | 1.15% | 9.35% |
| Middle | 3.80% | 3.26% | 2.54% | 9.60% | |
| High | 1.99% | 3.20% | 4.39% | 9.59% | |
| Maryland | Low | 5.25% | 2.04% | 2.41% | 9.70% |
| Middle | 4.02% | 2.48% | 4.30% | 10.80% | |
| High | 2.09% | 2.68% | 5.64% | 10.40% | |
| Massachusetts | Low | 3.92% | 3.77% | 2.23% | 9.92% |
| Middle | 2.95% | 3.22% | 3.67% | 9.85% | |
| High | 1.92% | 3.10% | 4.15% | 9.16% | |
| Michigan | Low | 4.97% | 2.01% | 2.52% | 9.50% |
| Middle | 3.58% | 2.60% | 3.32% | 9.50% | |
| High | 2.00% | 2.58% | 3.61% | 8.19% | |
| Minnesota | Low | 5.38% | 2.64% | 1.56% | 9.58% |
| Middle | 4.21% | 2.79% | 2.94% | 9.94% | |
| High | 2.41% | 2.73% | 4.78% | 9.92% | |
| Mississippi | Low | 7.17% | 2.20% | 1.40% | 10.77% |
| Middle | 5.78% | 2.07% | 2.34% | 10.19% | |
| High | 2.81% | 1.60% | 2.71% | 7.12% | |
| Missouri | Low | 5.14% | 2.68% | 1.68% | 9.51% |
| Middle | 3.99% | 2.30% | 2.91% | 9.20% | |
| High | 2.27% | 2.30% | 3.75% | 8.32% | |
| Montana | Low | 1.92% | 3.22% | 0.96% | 6.10% |
| Middle | 1.16% | 2.66% | 2.76% | 6.59% | |
| High | 0.46% | 2.29% | 3.67% | 6.42% | |
| Nebraska | Low | 5.82% | 3.61% | 0.80% | 10.23% |
| Middle | 4.57% | 3.31% | 2.53% | 10.41% | |
| High | 2.48% | 3.00% | 3.66% | 9.14% | |
| Nevada | Low | 4.80% | 1.60% | 0.60% | 7.00% |
| Middle | 3.59% | 2.16% | 0.53% | 6.28% | |
| High | 2.21% | 2.05% | 0.46% | 4.71% | |
| New Hampshire | Low | 2.19% | 5.20% | 0.60% | 7.99% |
| Middle | 1.65% | 5.18% | 0.60% | 7.43% | |
| High | 0.72% | 3.94% | 0.70% | 5.36% | |
| New Jersey | Low | 4.65% | 5.30% | 0.09% | 10.03% |
| Middle | 3.51% | 4.80% | 1.40% | 9.71% | |
| High | 2.02% | 5.07% | 3.20% | 10.29% | |
| New Mexico | Low | 7.98% | 1.80% | 0.60% | 10.37% |
| Middle | 6.13% | 1.74% | 2.16% | 10.03% | |
| High | 3.19% | 1.46% | 3.23% | 7.87% | |
| New York | Low | 6.37% | 4.30% | 0.21% | 10.89% |
| Middle | 4.75% | 4.17% | 3.49% | 12.41% | |
| High | 2.58% | 4.27% | 5.56% | 12.40% | |
| North Carolina | Low | 5.04% | 1.66% | 2.62% | 9.32% |
| Middle | 3.65% | 2.10% | 3.62% | 9.37% | |
| High | 2.02% | 2.05% | 4.33% | 8.40% | |
| North Dakota | Low | 6.34% | 1.50% | 0.53% | 8.37% |
| Middle | 5.58% | 1.57% | 0.78% | 7.92% | |
| High | 3.00% | 1.50% | 1.20% | 5.70% | |
| Ohio | Low | 5.88% | 3.18% | 2.40% | 11.46% |
| Middle | 4.57% | 2.60% | 3.34% | 10.51% | |
| High | 2.99% | 2.53% | 4.10% | 9.62% | |
| Oklahoma | Low | 6.80% | 1.94% | 1.16% | 9.90% |
| Middle | 5.37% | 1.53% | 2.44% | 9.34% | |
| High | 3.15% | 1.32% | 3.31% | 7.77% | |
| Oregon | Low | 1.53% | 3.47% | 3.00% | 7.99% |
| Middle | 0.93% | 2.84% | 4.74% | 8.51% | |
| High | 0.42% | 2.64% | 5.73% | 8.78% | |
| Pennsylvania | Low | 4.85% | 3.15% | 3.40% | 11.39% |
| Middle | 3.40% | 2.80% | 3.90% | 10.10% | |
| High | 1.95% | 3.00% | 3.96% | 8.91% | |
| Rhode Island | Low | 5.59% | 3.71% | 0.99% | 10.28% |
| Middle | 3.88% | 4.47% | 2.30% | 10.65% | |
| High | 2.17% | 4.39% | 3.30% | 9.85% | |
| South Carolina | Low | 4.12% | 2.09% | 0.88% | 7.08% |
| Middle | 3.61% | 2.05% | 2.35% | 8.01% | |
| High | 1.78% | 1.70% | 3.83% | 7.31% | |
| South Dakota | Low | 7.61% | 2.19% | 0.00% | 9.80% |
| Middle | 5.37% | 1.80% | 0.00% | 7.17% | |
| High | 3.09% | 2.09% | 0.00% | 5.17% | |
| Tennessee | Low | 7.44% | 1.73% | 0.00% | 9.17% |
| Middle | 5.41% | 1.51% | 0.10% | 7.02% | |
| High | 3.27% | 1.51% | 0.19% | 4.97% | |
| Texas | Low | 7.72% | 2.85% | 0.00% | 10.57% |
| Middle | 4.88% | 2.67% | 0.00% | 7.55% | |
| High | 3.34% | 3.19% | 0.00% | 6.53% | |
| Utah | Low | 5.64% | 1.96% | 1.00% | 8.60% |
| Middle | 3.65% | 1.70% | 3.35% | 8.70% | |
| High | 2.14% | 1.59% | 4.02% | 7.75% | |
| Vermont | Low | 4.64% | 4.50% | 0.20% | 9.34% |
| Middle | 3.55% | 4.71% | 1.61% | 9.86% | |
| High | 1.87% | 4.27% | 3.30% | 9.44% | |
| Virginia | Low | 4.01% | 2.40% | 2.41% | 8.81% |
| Middle | 3.00% | 2.30% | 3.49% | 8.80% | |
| High | 1.67% | 2.53% | 4.16% | 8.36% | |
| Washington | Low | 9.76% | 3.27% | 0.00% | 13.03% |
| Middle | 8.16% | 2.53% | 0.00% | 10.69% | |
| High | 4.17% | 2.22% | 0.00% | 6.38% | |
| West Virginia | Low | 5.48% | 1.28% | 1.89% | 8.65% |
| Middle | 4.44% | 1.19% | 3.29% | 8.93% | |
| High | 2.15% | 1.30% | 4.68% | 8.13% | |
| Wisconsin | Low | 5.04% | 3.23% | 1.49% | 9.76% |
| Middle | 3.60% | 3.52% | 3.56% | 10.68% | |
| High | 2.11% | 3.34% | 4.44% | 9.89% | |
| Wyoming | Low | 5.53% | 2.16% | 0.00% | 7.68% |
| Middle | 4.65% | 2.00% | 0.00% | 6.65% | |
| High | 2.22% | 1.76% | 0.00% | 3.98% |
Subscribe to:
Comments (Atom)