Tuesday, March 24, 2015

2015’s Best States to Be Rich or Poor from a Tax Perspective | WalletHub®

      Tax Burden By State and Income Level      

State
“Low Income” Rank
(Tax Burden as a % of Income)
“Middle Income” Rank
(Tax Burden as a % of Income)
“High Income” Rank
(Tax Burden as a % of Income)
Alabama25
(9.61%)
20
(8.82%)
9
(6.03%)
Alaska1
(5.40%)
1
(4.50%)
1
(3.43%)
Arizona48
(11.70%)
18
(8.75%)
18
(7.36%)
Arkansas46
(11.46%)
49
(11.29%)
37
(9.16%)
California21
(9.49%)
15
(8.58%)
39
(9.35%)
Colorado14
(8.68%)
17
(8.73%)
16
(7.26%)
Connecticut34
(10.04%)
46
(10.77%)
50
(11.19%)
Delaware2
(5.43%)
2
(5.70%)
10
(6.14%)
District of Columbia7
(7.76%)
37
(10.16%)
43
(9.80%)
Florida17
(9.23%)
10
(7.67%)
7
(5.56%)
Georgia30
(9.87%)
30
(9.77%)
30
(8.46%)
Hawaii50
(12.30%)
48
(10.86%)
31
(8.72%)
Idaho11
(8.47%)
11
(7.73%)
22
(7.94%)
Illinois49
(12.10%)
50
(11.30%)
44
(9.83%)
Indiana44
(11.19%)
45
(10.72%)
24
(8.19%)
Iowa39
(10.47%)
35
(10.03%)
33
(8.90%)
Kansas29
(9.84%)
26
(9.50%)
26
(8.31%)
Kentucky41
(10.62%)
40
(10.44%)
35
(9.10%)
Louisiana35
(10.05%)
27
(9.57%)
14
(6.91%)
Maine20
(9.35%)
28
(9.60%)
41
(9.59%)
Maryland26
(9.70%)
47
(10.80%)
49
(10.40%)
Massachusetts32
(9.92%)
31
(9.85%)
38
(9.16%)
Michigan22
(9.50%)
25
(9.50%)
25
(8.19%)
Minnesota24
(9.58%)
33
(9.94%)
47
(9.92%)
Mississippi42
(10.77%)
38
(10.19%)
15
(7.12%)
Missouri23
(9.51%)
22
(9.20%)
27
(8.32%)
Montana3
(6.10%)
4
(6.59%)
12
(6.42%)
Nebraska36
(10.23%)
39
(10.41%)
36
(9.14%)
Nevada4
(7.00%)
3
(6.28%)
3
(4.71%)
New Hampshire8
(7.99%)
8
(7.43%)
6
(5.36%)
New Jersey33
(10.03%)
29
(9.71%)
48
(10.29%)
New Mexico38
(10.37%)
34
(10.03%)
21
(7.87%)
New York43
(10.89%)
51
(12.41%)
51
(12.40%)
North Carolina18
(9.32%)
24
(9.37%)
29
(8.40%)
North Dakota10
(8.37%)
12
(7.92%)
8
(5.70%)
Ohio47
(11.46%)
41
(10.51%)
42
(9.62%)
Oklahoma31
(9.90%)
23
(9.34%)
20
(7.77%)
Oregon9
(7.99%)
14
(8.51%)
32
(8.78%)
Pennsylvania45
(11.39%)
36
(10.10%)
34
(8.91%)
Rhode Island37
(10.28%)
42
(10.65%)
45
(9.85%)
South Carolina5
(7.08%)
13
(8.01%)
17
(7.31%)
South Dakota28
(9.80%)
7
(7.17%)
5
(5.17%)
Tennessee16
(9.17%)
6
(7.02%)
4
(4.97%)
Texas40
(10.57%)
9
(7.55%)
13
(6.53%)
Utah12
(8.60%)
16
(8.70%)
19
(7.75%)
Vermont19
(9.34%)
32
(9.86%)
40
(9.44%)
Virginia15
(8.81%)
19
(8.80%)
28
(8.36%)
Washington51
(13.03%)
44
(10.69%)
11
(6.38%)
West Virginia13
(8.65%)
21
(8.93%)
23
(8.13%)
Wisconsin27
(9.76%)
43
(10.68%)
46
(9.89%)
Wyoming6
(7.68%)
5
(6.65%)
2
(3.98%)


Best-States-to-be-Rich-&-Poor-from-a-Tax-Perspective-Artwork-v2

Detailed Findings

StateIncome LevelSales Tax as % of IncomeProperty Tax  as % of IncomeIncome Tax as % of IncomeTotal Tax as % of Income
AlabamaLow6.26%1.23%2.13%9.61%
Middle5.01%1.13%2.68%8.82%
High2.30%1.10%2.64%6.03%
AlaskaLow2.44%2.80%0.16%5.40%
Middle1.65%2.75%0.10%4.50%
High0.88%2.35%0.20%3.43%
ArizonaLow7.22%3.42%1.06%11.70%
Middle4.66%2.53%1.57%8.75%
High2.72%2.27%2.37%7.36%
ArkansasLow8.06%1.56%1.85%11.46%
Middle7.13%1.50%2.66%11.29%
High3.93%1.35%3.88%9.16%
CaliforniaLow6.25%2.81%0.43%9.49%
Middle4.47%2.71%1.40%8.58%
High2.35%2.85%4.15%9.35%
ColoradoLow4.89%2.10%1.69%8.68%
Middle4.07%2.12%2.54%8.73%
High1.99%2.00%3.27%7.26%
ConnecticutLow5.02%4.81%0.21%10.04%
Middle3.81%4.71%2.25%10.77%
High2.46%4.33%4.40%11.19%
DelawareLow2.01%1.64%1.78%5.43%
Middle1.27%1.40%3.03%5.70%
High0.72%1.26%4.16%6.14%
District of ColumbiaLow5.47%2.15%0.14%7.76%
Middle4.44%2.00%3.72%10.16%
High2.45%2.15%5.19%9.80%
FloridaLow7.32%1.91%0.00%9.23%
Middle5.45%2.22%0.00%7.67%
High3.14%2.40%0.02%5.56%
GeorgiaLow5.32%2.30%2.25%9.87%
Middle4.30%2.30%3.17%9.77%
High2.33%2.20%3.93%8.46%
HawaiiLow8.50%1.20%2.60%12.30%
Middle5.59%1.42%3.85%10.86%
High3.06%1.26%4.40%8.72%
IdahoLow5.10%2.44%0.93%8.47%
Middle3.84%1.76%2.13%7.73%
High2.06%1.60%4.29%7.94%
IllinoisLow5.62%4.42%2.06%12.10%
Middle4.37%4.11%2.82%11.30%
High2.48%4.36%3.00%9.83%
IndianaLow6.31%1.93%2.95%11.19%
Middle4.73%2.27%3.71%10.72%
High2.49%2.05%3.66%8.19%
IowaLow5.63%2.65%2.20%10.47%
Middle4.50%2.50%3.03%10.03%
High2.24%2.57%4.10%8.90%
KansasLow6.87%2.53%0.44%9.84%
Middle5.12%2.60%1.78%9.50%
High2.99%2.68%2.64%8.31%
KentuckyLow5.14%1.71%3.77%10.62%
Middle3.83%1.74%4.87%10.44%
High2.11%1.83%5.16%9.10%
LouisianaLow7.75%0.99%1.31%10.05%
Middle6.50%0.90%2.17%9.57%
High3.39%0.92%2.60%6.91%
MaineLow5.20%3.01%1.15%9.35%
Middle3.80%3.26%2.54%9.60%
High1.99%3.20%4.39%9.59%
MarylandLow5.25%2.04%2.41%9.70%
Middle4.02%2.48%4.30%10.80%
High2.09%2.68%5.64%10.40%
MassachusettsLow3.92%3.77%2.23%9.92%
Middle2.95%3.22%3.67%9.85%
High1.92%3.10%4.15%9.16%
MichiganLow4.97%2.01%2.52%9.50%
Middle3.58%2.60%3.32%9.50%
High2.00%2.58%3.61%8.19%
MinnesotaLow5.38%2.64%1.56%9.58%
Middle4.21%2.79%2.94%9.94%
High2.41%2.73%4.78%9.92%
MississippiLow7.17%2.20%1.40%10.77%
Middle5.78%2.07%2.34%10.19%
High2.81%1.60%2.71%7.12%
MissouriLow5.14%2.68%1.68%9.51%
Middle3.99%2.30%2.91%9.20%
High2.27%2.30%3.75%8.32%
MontanaLow1.92%3.22%0.96%6.10%
Middle1.16%2.66%2.76%6.59%
High0.46%2.29%3.67%6.42%
NebraskaLow5.82%3.61%0.80%10.23%
Middle4.57%3.31%2.53%10.41%
High2.48%3.00%3.66%9.14%
NevadaLow4.80%1.60%0.60%7.00%
Middle3.59%2.16%0.53%6.28%
High2.21%2.05%0.46%4.71%
New HampshireLow2.19%5.20%0.60%7.99%
Middle1.65%5.18%0.60%7.43%
High0.72%3.94%0.70%5.36%
New JerseyLow4.65%5.30%0.09%10.03%
Middle3.51%4.80%1.40%9.71%
High2.02%5.07%3.20%10.29%
New MexicoLow7.98%1.80%0.60%10.37%
Middle6.13%1.74%2.16%10.03%
High3.19%1.46%3.23%7.87%
New YorkLow6.37%4.30%0.21%10.89%
Middle4.75%4.17%3.49%12.41%
High2.58%4.27%5.56%12.40%
North CarolinaLow5.04%1.66%2.62%9.32%
Middle3.65%2.10%3.62%9.37%
High2.02%2.05%4.33%8.40%
North DakotaLow6.34%1.50%0.53%8.37%
Middle5.58%1.57%0.78%7.92%
High3.00%1.50%1.20%5.70%
OhioLow5.88%3.18%2.40%11.46%
Middle4.57%2.60%3.34%10.51%
High2.99%2.53%4.10%9.62%
OklahomaLow6.80%1.94%1.16%9.90%
Middle5.37%1.53%2.44%9.34%
High3.15%1.32%3.31%7.77%
OregonLow1.53%3.47%3.00%7.99%
Middle0.93%2.84%4.74%8.51%
High0.42%2.64%5.73%8.78%
PennsylvaniaLow4.85%3.15%3.40%11.39%
Middle3.40%2.80%3.90%10.10%
High1.95%3.00%3.96%8.91%
Rhode IslandLow5.59%3.71%0.99%10.28%
Middle3.88%4.47%2.30%10.65%
High2.17%4.39%3.30%9.85%
South CarolinaLow4.12%2.09%0.88%7.08%
Middle3.61%2.05%2.35%8.01%
High1.78%1.70%3.83%7.31%
South DakotaLow7.61%2.19%0.00%9.80%
Middle5.37%1.80%0.00%7.17%
High3.09%2.09%0.00%5.17%
TennesseeLow7.44%1.73%0.00%9.17%
Middle5.41%1.51%0.10%7.02%
High3.27%1.51%0.19%4.97%
TexasLow7.72%2.85%0.00%10.57%
Middle4.88%2.67%0.00%7.55%
High3.34%3.19%0.00%6.53%
UtahLow5.64%1.96%1.00%8.60%
Middle3.65%1.70%3.35%8.70%
High2.14%1.59%4.02%7.75%
VermontLow4.64%4.50%0.20%9.34%
Middle3.55%4.71%1.61%9.86%
High1.87%4.27%3.30%9.44%
VirginiaLow4.01%2.40%2.41%8.81%
Middle3.00%2.30%3.49%8.80%
High1.67%2.53%4.16%8.36%
WashingtonLow9.76%3.27%0.00%13.03%
Middle8.16%2.53%0.00%10.69%
High4.17%2.22%0.00%6.38%
West VirginiaLow5.48%1.28%1.89%8.65%
Middle4.44%1.19%3.29%8.93%
High2.15%1.30%4.68%8.13%
WisconsinLow5.04%3.23%1.49%9.76%
Middle3.60%3.52%3.56%10.68%
High2.11%3.34%4.44%9.89%
WyomingLow5.53%2.16%0.00%7.68%
Middle4.65%2.00%0.00%6.65%
High2.22%1.76%0.00%3.98%

Friday, March 20, 2015

CEH: How to Doubt a Consensus


How to Doubt a Consensus

Print Article
Posted on March 16, 2015 in Darwin and Evolution, Education, Media, Mind and Brain, Philosophy of Science, Politics and Ethics
You don’t need to be a “denialist.” Just read the fine print in their own publications, and understand the limits of science.
There’s a prime opportunity going on right now to observe the behavior of a scientific consensus. On the one hand, a large majority of atmospheric scientists report near certainty that the climate is warming, and man is causing it. This consensus reaches to international proportions, motivating global conferences on how to mitigate catastrophic changes they predict, such as rising sea levels, drought and extinctions of species. Treaties are being written that could have drastic effects on national economies and trade – all because the scientific consensus says disaster is coming unless we act. They typically rely on the authority of science for their confidence.
On the other hand, there is a substantial movement outside the consensus. Disparagingly called “denialists” by the consensus, this group includes scientists and activists who, just as confidently, criticize the scientific basis for blaming humans for global warming. Interestingly, the two opposing groups are largely divided along political lines: leftists for the consensus, rightists against it.  Some on the extreme of this group find evidence of conspiracy on the other side (e.g., the near-sudden nomenclature change a few years ago from “global warming” to “climate change,” funding bias, involvement of the U.N. and leftist NGOs, etc.). What is a citizen to believe?
Incidentally, Florida, North Carolina, Louisiana and Tennessee have banned the term “climate change” by state environmental officials, according to Live Science. Reporter Tanya Lewis calls this an “attempt to cast doubt on established climate science in boardrooms and classrooms,” showing her pro-consensus bias.
The goal of this entry is not to take a position on the central issue (whether man is causing it, if warming is occurring), but to investigate the way it is reported and, at a deeper level, to see whether this is an issue one can be confident about (see “What is the temperature of the Earth?”, 1/15/15). The consensus is often so strong, some of its defenders think the “denialists” should be silenced. Yet their confidence is sometimes hard to square with troubling reports about details germane to the theory. Is the consensus a house of cards? The following are all taken from consensus-trusting sources:
  1. CO2 emissions may have stalled in 2014 – why? (New Scientist). Global CO2 emissions stall despite economic growth: IEA (PhysOrg, BBC News). Without significant human intervention, last year’s carbon dioxide emissions went down. This has left climate scientists scrambling for auxiliary hypotheses to explain why. Consensus scientists call this encouraging, but no time for complacency. Others tried to link previous stalls with economic downturns. Some say China’s initiatives must be working. If that is true, what more action is needed? PhysOrg says China is falling behind on pollution.
  2. Interaction of Atlantic and Pacific oscillations caused ‘false pause’ in warming(Science Daily). Yes, there was a 15-year pause in temperature rise, Penn State climatologists admit, but “They do not signal any slowdown in human-caused global warming.” The hiatus was just part of “natural oscillations,” they say.  One of the experts in the article is Michael Mann, accused by climate skeptics of fudging data to make his famous “hockey stick” diagram support the consensus. Science Magazine also admits the hiatus and supported the new explanation. Another piece in Science Magazine assures readers that the hiatus is about to end. If they didn’t expect the hiatus, how can they expect its ending?
  3. Climate change: global warming could speed up (Nature). “The rate of global warmingcould more than double over the coming decades, as greenhouse gases build up in Earth’s atmosphere,” this short article in Nature warns, based on simulations done in Maryland by climate scientists. They even get more specific: “The Arctic, Europe and North America will probably see larger increases in warming rates than the global average.” How could this be tested without waiting 40 years? Skeptics might complain this is a scare tactic. Models have been notoriously unreliable, not taking into account various unknowns—and an unknown number of “unknown unknowns”. For instance, Science Daily reported that “small eddies produce global effects on climate change,” and these effects—not previously considered—extend the cooling capacity of the oceans, “effectively delaying the impacts of global warming.” What other factors have not been considered in the models which, at best, are oversimplifications of reality?
  4. Climate science literacy unrelated to public acceptance of human-caused global warming (PhysOrg). Consensus supporters cannot blame deniers of being ignorant. “Deep public divisions over climate change are unrelated to differences in how well ordinary citizens understand scientific evidence on global warming,” the article begins. “Indeed,members of the public who score the highest on a climate-science literacy test are the most politically polarized on whether human activity is causing global temperatures to rise.”
  5. Climate leadership in question as IPCC chief resigns (Nature). “Chairman Rajendra Pachauri stands down amid allegations of sexual harassment.” While sexual misconduct has nothing to do with scientific data about climate, it does speak to character. This revelation creates a climate of mistrust about the integrity of the top man at the IPCC who purported to assure to the world that humans are blameworthy for the planet’s warming.
  6. Evolving to cope with climate change (Science Daily). Is it really possible to tell whether a few fish in a lab can say anything about their capability to adapt to proposed climate changes two centuries from now? Who will be around to prove them right or wrong? This kind of stretched reasoning makes it hard for climate skeptics to take the consensus seriously. Experiments could be concocted to prove either position.
  7. New carbon accounting method proposed (Science Daily). Researchers at Lund University point out a misleading measure of climate remediation. “In some cases, countries are even rewarded for policies that increase global emissions, and punished for policies that contribute to reducing them,” the article begins. “Consumption-based accounting, also known as carbon footprints, has been suggested as an alternative to today’s production-based accounting.” What does this do to conclusions drawn from the old methods?
  8. Earth science is not hard science, congressional Republicans declare (Science Magazine). In a debate that bears on philosophy of taxonomy, Jeffrey Mervis quotes advocates of both camps arguing that earth science is, or is not, “hard science.” The answer to that question would obviously impinge on the confidence of the climate consensus, but the article is more concerned about the impact on future funding.
  9. Climate engineering no longer on the fringe (PhysOrg). The headline implies that people who want to engineer the climate were, until recently, considered “fringe” (like their skeptics have been so named). Does bringing the subject up to the National Academy of Sciences move “discussion of the controversial topic into the mainstream science community”? David Keith, a climate activist, presents his ideas on overcoming political and social obstacles to geoengineering. It’s just this kind of tampering with nature by “global governance” that upsets a lot of people.
  10. Whose ox is gored: Recently, a congressional Democrat started investigating the funding of climate skeptic Willie Soon of Harvard. This reminded Nature’s editors of a similar but reverse case by a Republican years ago. They warned against investigators of either party going on fishing expeditions to impugn the motives of scientists on either side. “Scientists must view their funding sources as public information that is always subject to scrutiny, and act accordingly,” the editors acknowledged. “But when politicians seek to probe beyondpossible sources of external influence on published work and attempt to expose internal discussions that they find inconvenient, that sends a chilling message to all academics and to the wider public.”
  11. Did climate change drive the Syrian uprising? (Science Magazine). The power of suggestion is applied in a short article by Carolyn Gramling that omits the most important factor in Syrian politics: religious ideology. A correlation that the authors of “a new study” drew is limited to the middle east, but omits to consider similar uprisings in tropical Africa and Indonesia. It also doesn’t account for peaceful initiatives taking place in locations with similar climates as Syria. Any philosopher should look askance at such questionable inferences.
  12. Will We Combat Global Warming, Despite Our Nature? (Live Science). Possibly the most absurd conclusion of all is drawn in this Op-Ed piece by Raghu Murtugudde of the University of Maryland. He draws inferences about human nature from evolutionary theory, then asks if we can overcome them. If our nature evolved, though, to what moral standard can he appeal? By his own worldview, he is a result of evolutionary forces himself.
These are the kinds of findings and claims that motivate skepticism of the consensus. Data produced by a model are not capable, in and of themselves, of drawing conclusions. Creating models and interpreting them must be done by fallible human beings who are subject to various impulses and influences outside of science. As the articles above show, politics and evolutionary belief play strongly into consensus attitudes about climate change, and the responses of skeptics. In the eyes of many, scientists should act as impartial investigators who report the facts as best they can. What to do about the facts inevitably gets politicians and taxpayers involved.
We wouldn’t be reporting so much on the “climate change” debate if it didn’t have such clear overlap with the way Darwinian evolution is portrayed. How often have we seen the “all scientists agree” tactic used to defend Charlie? These are two issues that are so broad (involving all of the planet in their domains) that they cannot be defended empirically without major assumptions. Human elements—whether political, moral, or spiritual—need to be factored into the models, too.
It will be interesting to watch if the climate behaves like the consensus expects it will. For 15 years, it has not. “Just wait!” the believers say. “The hiatus is about to end!” But they didn’t factor in the global cooling effect of small eddies (#3 above) and other unknowns. Easterners, shoveling out of record snowstorms one after another, are grimacing at Al Gore. Just a few years ago, the climate consensus predicted record hurricanes, but those have been unusually quiet. Almost any observable weather has been used to support or deny global warming. The reputation of “big science” is on the line. For those interested in the philosophy of science, this is indeed an interesting case to watch. We must all remember, though, that consensus is not science, and science is not consensus. Kick that word out of science; it reeks of politics. Follow the evidence where it leads. The Lone Ranger is sometimes right.

Sunday, March 1, 2015

The 2015 Sony World Photography Awards - The Atlantic

The 2015 Sony World Photography Awards

The Sony World Photography Awards, an annual competition hosted by the World Photography Organisation, just announced its shortlist of winners. This year's contest attracted 173,444 entries from 171 countries. The organizers have been kind enough to share some of their shortlisted images with us, gathered below. Overall winners are scheduled to be announced on April 23. All captions below come from the photographers.
HINTS: View this page full screen. Skip to the next and previous photo by typing j/k or ←/→.
  • First Sight 2. Blind girls Sonia, 12, and Anita Singh, 5, were born into poverty with congenital cataract blindness. They must accompany their parents everywhere as they cannot be left alone without risk. The surgery to cure this is simple and takes 15 minutes but because of the level of poverty in this family, they have been unable to pursue the necessary operation. India has more than 12 million blind people, the majority of who suffer from cataract blindness. Poverty is the main reason these millions of people are trapped in this condition. Donor funding has recently enabled both sisters to finally go for this operation. This image is part of an essay made as an attempt to tell the story of their lives before surgery, during the operation to regain their sight and after, as they begin to discover light. 
    © Brent Stirton, South Africa, Shortlist, Contemporary Issues, Professional, 2015 Sony World Photography Awards
  • Split Second. A shot of a fly on a water surface. 
    © Uwe Hennig, Germany, Shortlist, Split Second, Open, 2015 Sony World Photography Awards
  • The Reflection. 
    © Sepehr Razmju, Iran, Shortlist, Environment, Youth Competition, 2015 Sony World Photography Awards
  • A black-tip reef shark patrols the edge of a recovering coral reef in search of a meal. 
    © Byron Dilkes, U.K., Shortlist, Travel, Open, 2015 Sony World Photography Awards
  • Photo taken during Artistic Gymnastics Tournament in Poland. Girls that participated were aged 8 to 12. 
    © Adrian Jaszczak, Poland, Shortlist, Arts & Culture, Open, 2015 Sony World Photography Awards
  • An aerial photograph of the Adriatic coastline between Ravenna and Rimini, Italy. Photographed in August 2014. 
    © Bernhard Lang, Germany, Shortlist, Travel, Professional Competition, 2015 Sony World Photography Awards
  • One in a series of images from the life of the photographer's family. 
    © Ramil Gilvanov/Rimma Gilvanova, Russia, Shortlist, Lifestyle, Professional Competition, 2015 Sony World Photography Awards
  • Black days of Ukraine, 1. Part of a series of photos taken in June and July near the city of Luhansk, Ukraine. In 2014, the conflict between rebels and the government army in Ukraine led the country to the full-scale hostilities. The local residents of the strategically located city of Luhansk were left without water and electricity for three months over the summer, while constant gunfire could be heard above their heads. 
    © Valery Melnikov/Rossiya Segodnya, Russia, Shortlist, Current Affairs, Professional Competition, 2015 Sony World Photography Awards/РИА Новости
  • Der Sozialismus siegt (Socialism is victorious). But the writing is already very faded - perhaps socialism yet does not win? 
    © Klaus Wäscher, Germany, Shortlist, Architecture, Open, 2015 Sony World Photography Awards
  • Blue Room. Omu Fereneh stands over her husband Ibrahim after he fell, knocking him unconscious in an Ebola holding center set up in a school classroom on August 15, 2014 in the West Point township of Monrovia, Liberia. He died the same day. The Liberian capital was quickly overwhelmed by the epidemic in late summer, as the Ebola virus moved from a rural to an urban environment, making Monrovia the Ebola epicenter in West Africa. Only a decade after a long civil war, Liberia's fragile health system was unable to cope, international agencies were slow to react, and fear gripped the nation. 
    © John Moore/Getty Images, United States, Shortlist, Current Affairs, Professional Competition, 2015 Sony World Photography Awards
  • Restricted Areas, 1. Part of a project about technological progress and the human striving for Utopia. I travel in search of places which used to have great importance for the technical progress—and which are now deserted. Those places lost their significance together with the utopian ideology which is now obsolete. Secret cities that cannot be found on maps, forgotten scientific triumphs, abandoned buildings of almost inhuman complexity. The perfect technocratic future that never came. 
    © Danila Tkachenko, Russia, Shortlist, Landscape, Professional Competition, 2015 Sony World Photography Awards
  • A fighting cock has a bath given by his caretaker. 
    © Panom Archarit, Thailand, Shortlist, Split Second, Open, 2015 Sony World Photography Awards
  • Blue Fields, 1. One of a series of images shot from a light aircraft flying at between 4,000 and 5,000 feet above the Useless Loop solar salt operation situated in Shark Bay, the westernmost point of mainland Australia. The height was crucial in order to flatten perspective by using long focal lengths. Time of day and cloud cover were also critical, the abstract effect being heightened by complete lack of signifying shadow. 
    © Simon Butterworth, U.K., Shortlist, Landscape, Professional Competition, 2015 Sony World Photography Award
  • When I Am Laid In Earth, 1. Mapping with a pyrograph, the melting away of the Lewis Glacier on Mt. Kenya. One of a series of fire lines I have drawn indicate where the front of the rapidly disappearing Lewis Glacier was at various times in the recent past. In the distance, a harvest moon lights the poor, doomed glacier remnant; the gap between the fire and the ice represents the relentless melting. 
    © Simon Norfolk, U.K., Shortlist, Landscape, Professional Competition, 2015 Sony World Photography Awards
  • Togo / Benin. 
    © Peter Voss, Germany, Shortlist, Smile, Open, 2015 Sony World Photography Awards
  • The Takanakuy is a traditional fighting festival held every December 25th in Cusco, Peru. 
    © David Martin Huamani Bedoya, Peru, Shortlist, Arts & Culture, Open, 2015 Sony World Photography Awards
  • Northern Lights 2. One of a series of images captured above the arctic circle in Norway. The wintertime in the northern part of Norway is extraordinary when speaking about light. Total darkness in December. In this series I have tried to combine sports and light. 
    © Clas Kristensen, Norway, Shortlist, Sport, Professional Competition, 2015 Sony World Photography Awards
  • One hundred and forty centimetres, 1. One in 700 babies are born with Down syndrome. Down syndrome is the most common chromosomal abnormality in newborns. Down syndrome is not a disease—it is not curable. People with Down syndrome have often physical and mental impairments that make them different from others. Since 2012 it has been possible to determine by means of non-invasive tests before birth whether a child will have Down syndrome, and determine to, if necessary, initiate an abortion. This is one shot in a series that raises questions about our relationship with the stigma of "living with impairment," and the technical possibilities to determine this even before birth. 
    © Sabine Lewandowski, Germany, Shortlist, People, Professional Competition, 2015 Sony World Photography Awards

2-28-15.jpg (792×612)


Sunday Cartoons - DickMorris.com at DickMorris.com


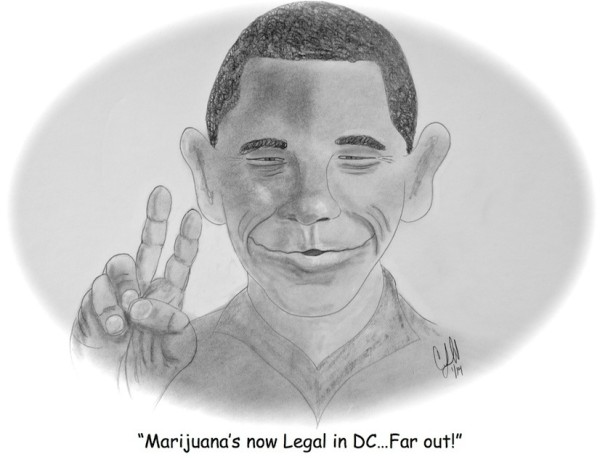
Far Out